Emin Gabrielyan
2007-03-12
Moiré patterns appear when superposing two transparent layers containing correlated opaque patterns. The case when layer patterns comprise straight or curved lines is called line moiré.
When moving the layer patterns, the moiré patterns transform or move at a faster speed. This effect is called moiré optical speedup.
This page demonstrates line moiré and optical speedup first, on examples with horizontal parallel lines, then on examples with inclined and curved lines.
1. Superposition of layers with periodically repeating parallel lines
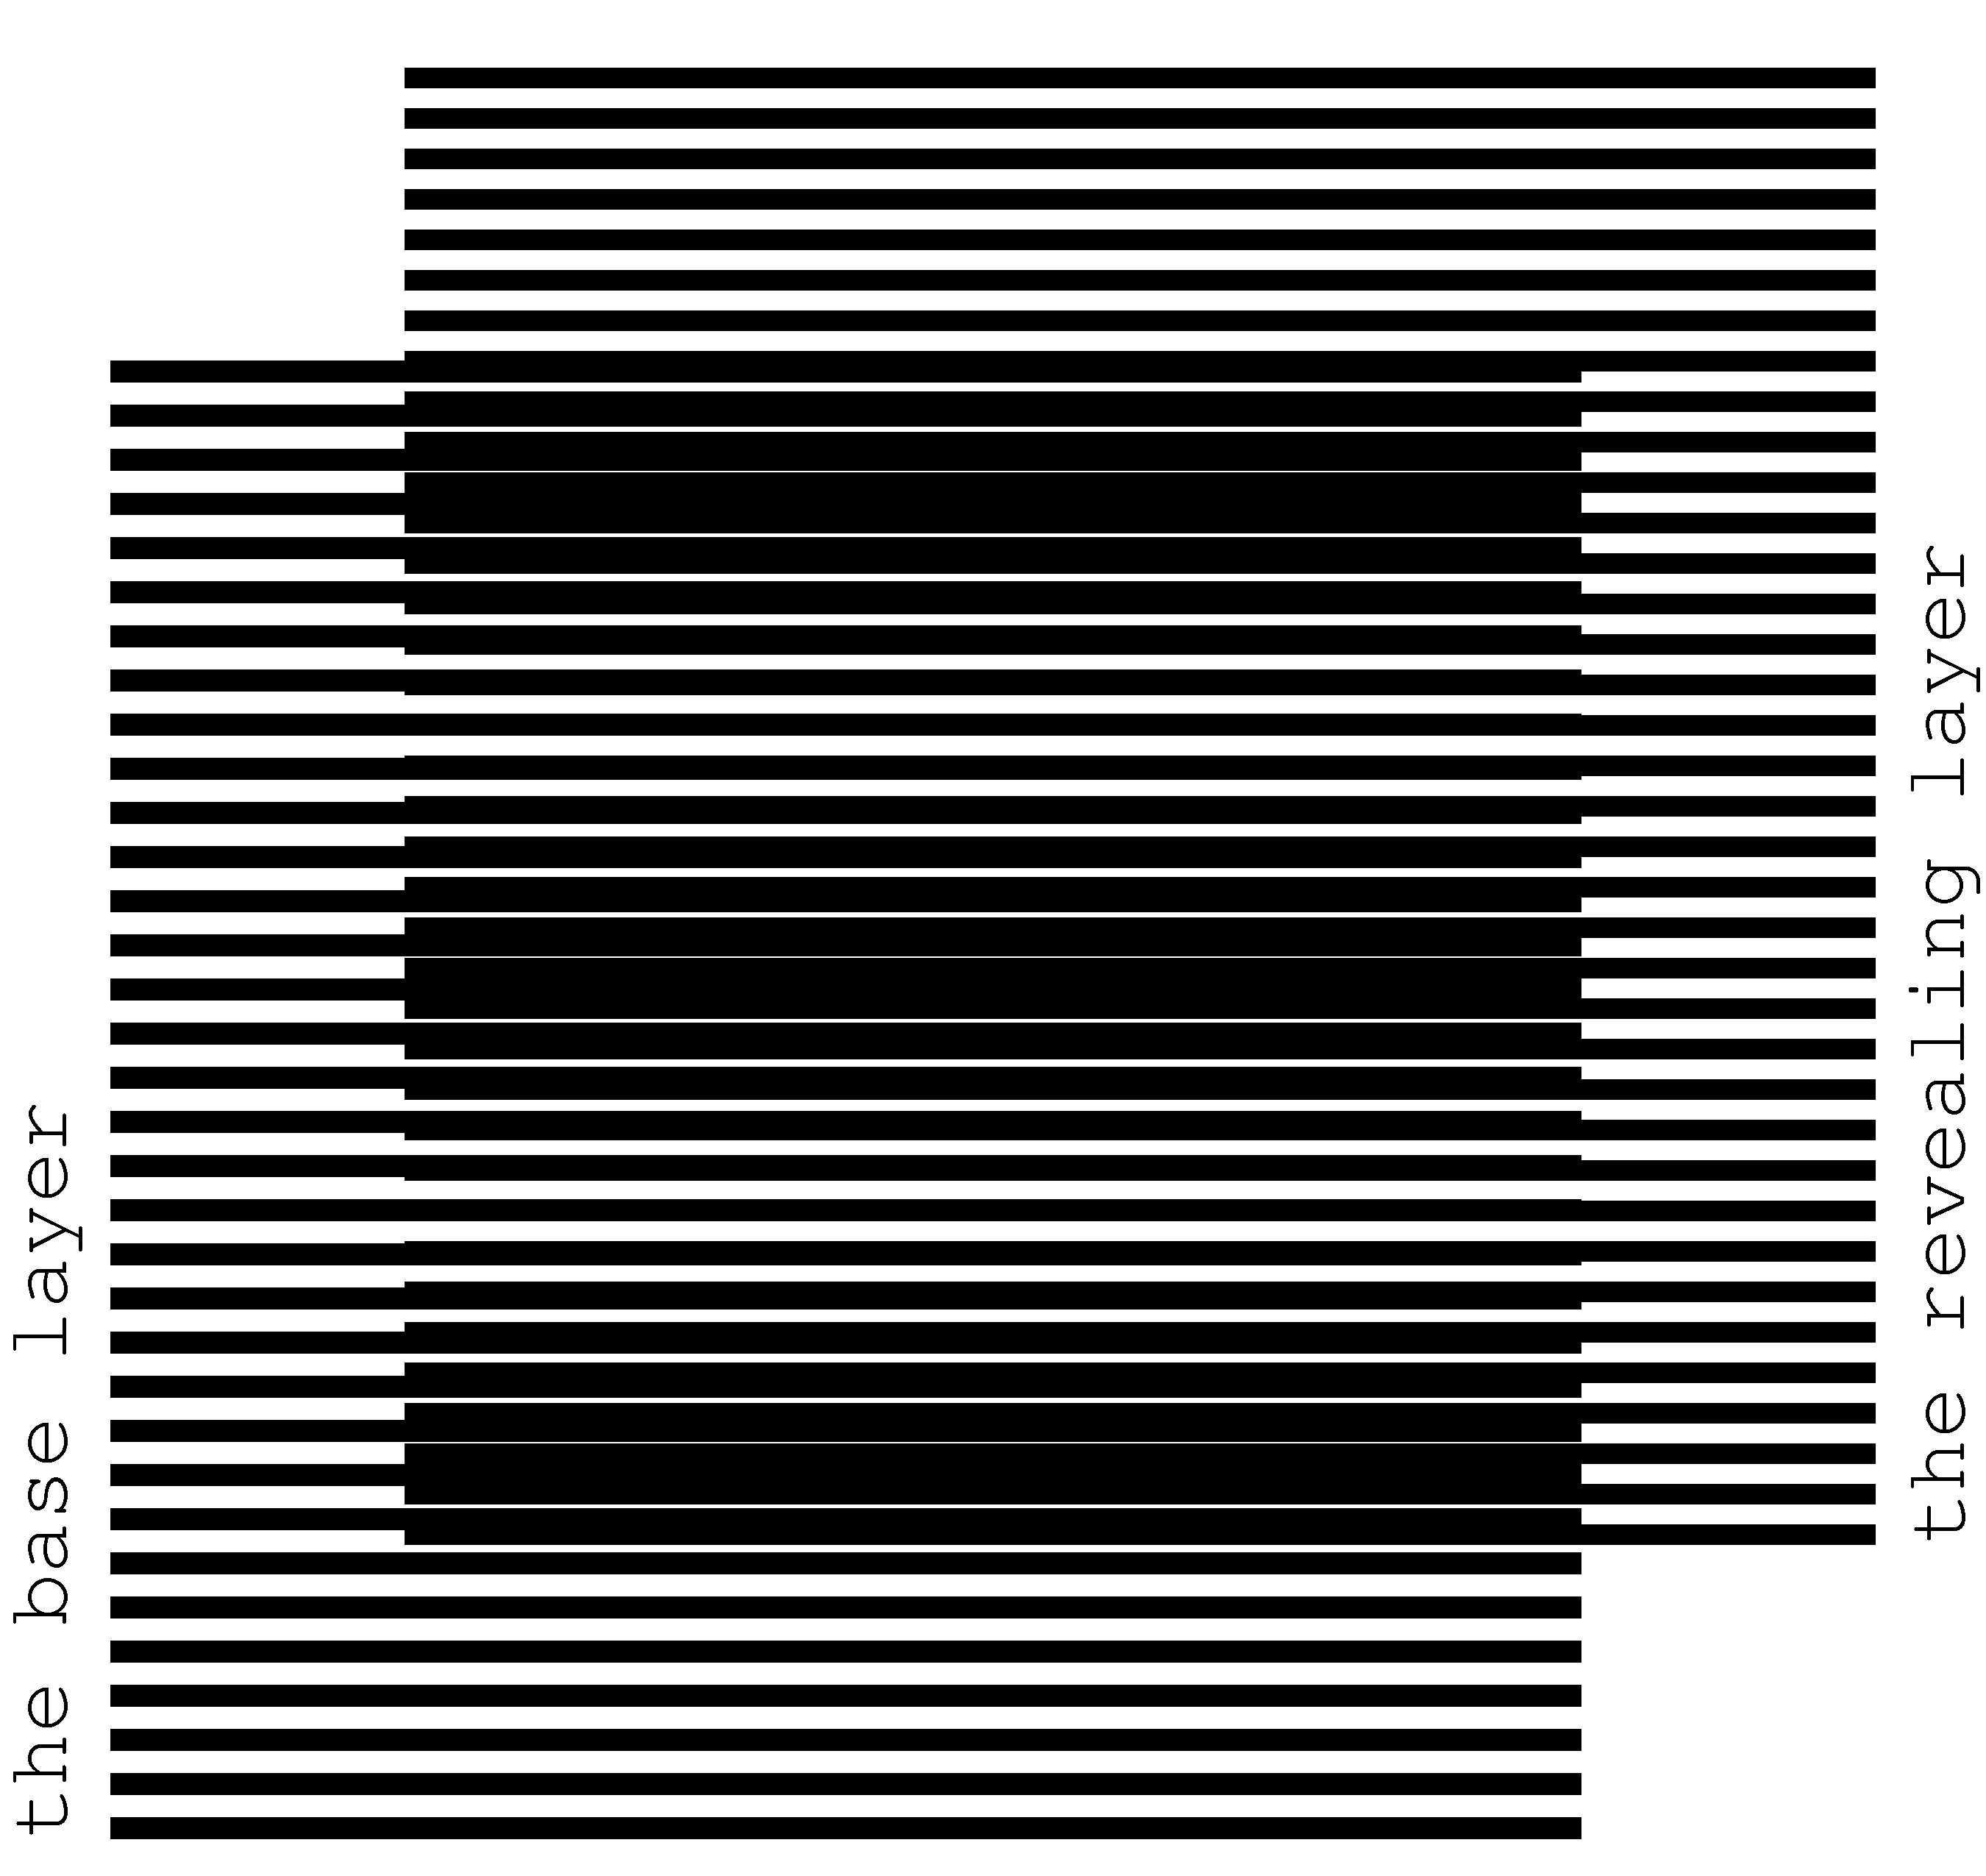
Simple moiré patterns can be observed when superposing two transparent layers comprising periodically repeating opaque parallel lines as shown in Figure 1. The lines of one layer are parallel to the lines of the second layer.

Figure 1. Superposition of two layers consisting of parallel lines, where the lines of the revealing layer are parallel to the lines of the base layer [eps], [png]
The superposition image does not change if transparent
layers with their opaque patterns are inverted. When considering printed
samples, one of the layers is denoted as the base layer and the other
one as the revealing layer. It is assumed that the revealing layer is
printed on a transparency and is superimposed on top of the base layer, which
can be printed either on a transparency or on an opaque paper. The periods of the
two layer patterns are close. We denote the period of the base layer as ![]() and the period of the revealing layer as
and the period of the revealing layer as
![]() .
.
The superposition image of Figure 1 outlines periodically repeating dark parallel bands, called moiré lines. Spacing between the moiré lines is much larger than the periods of lines in the two layers.
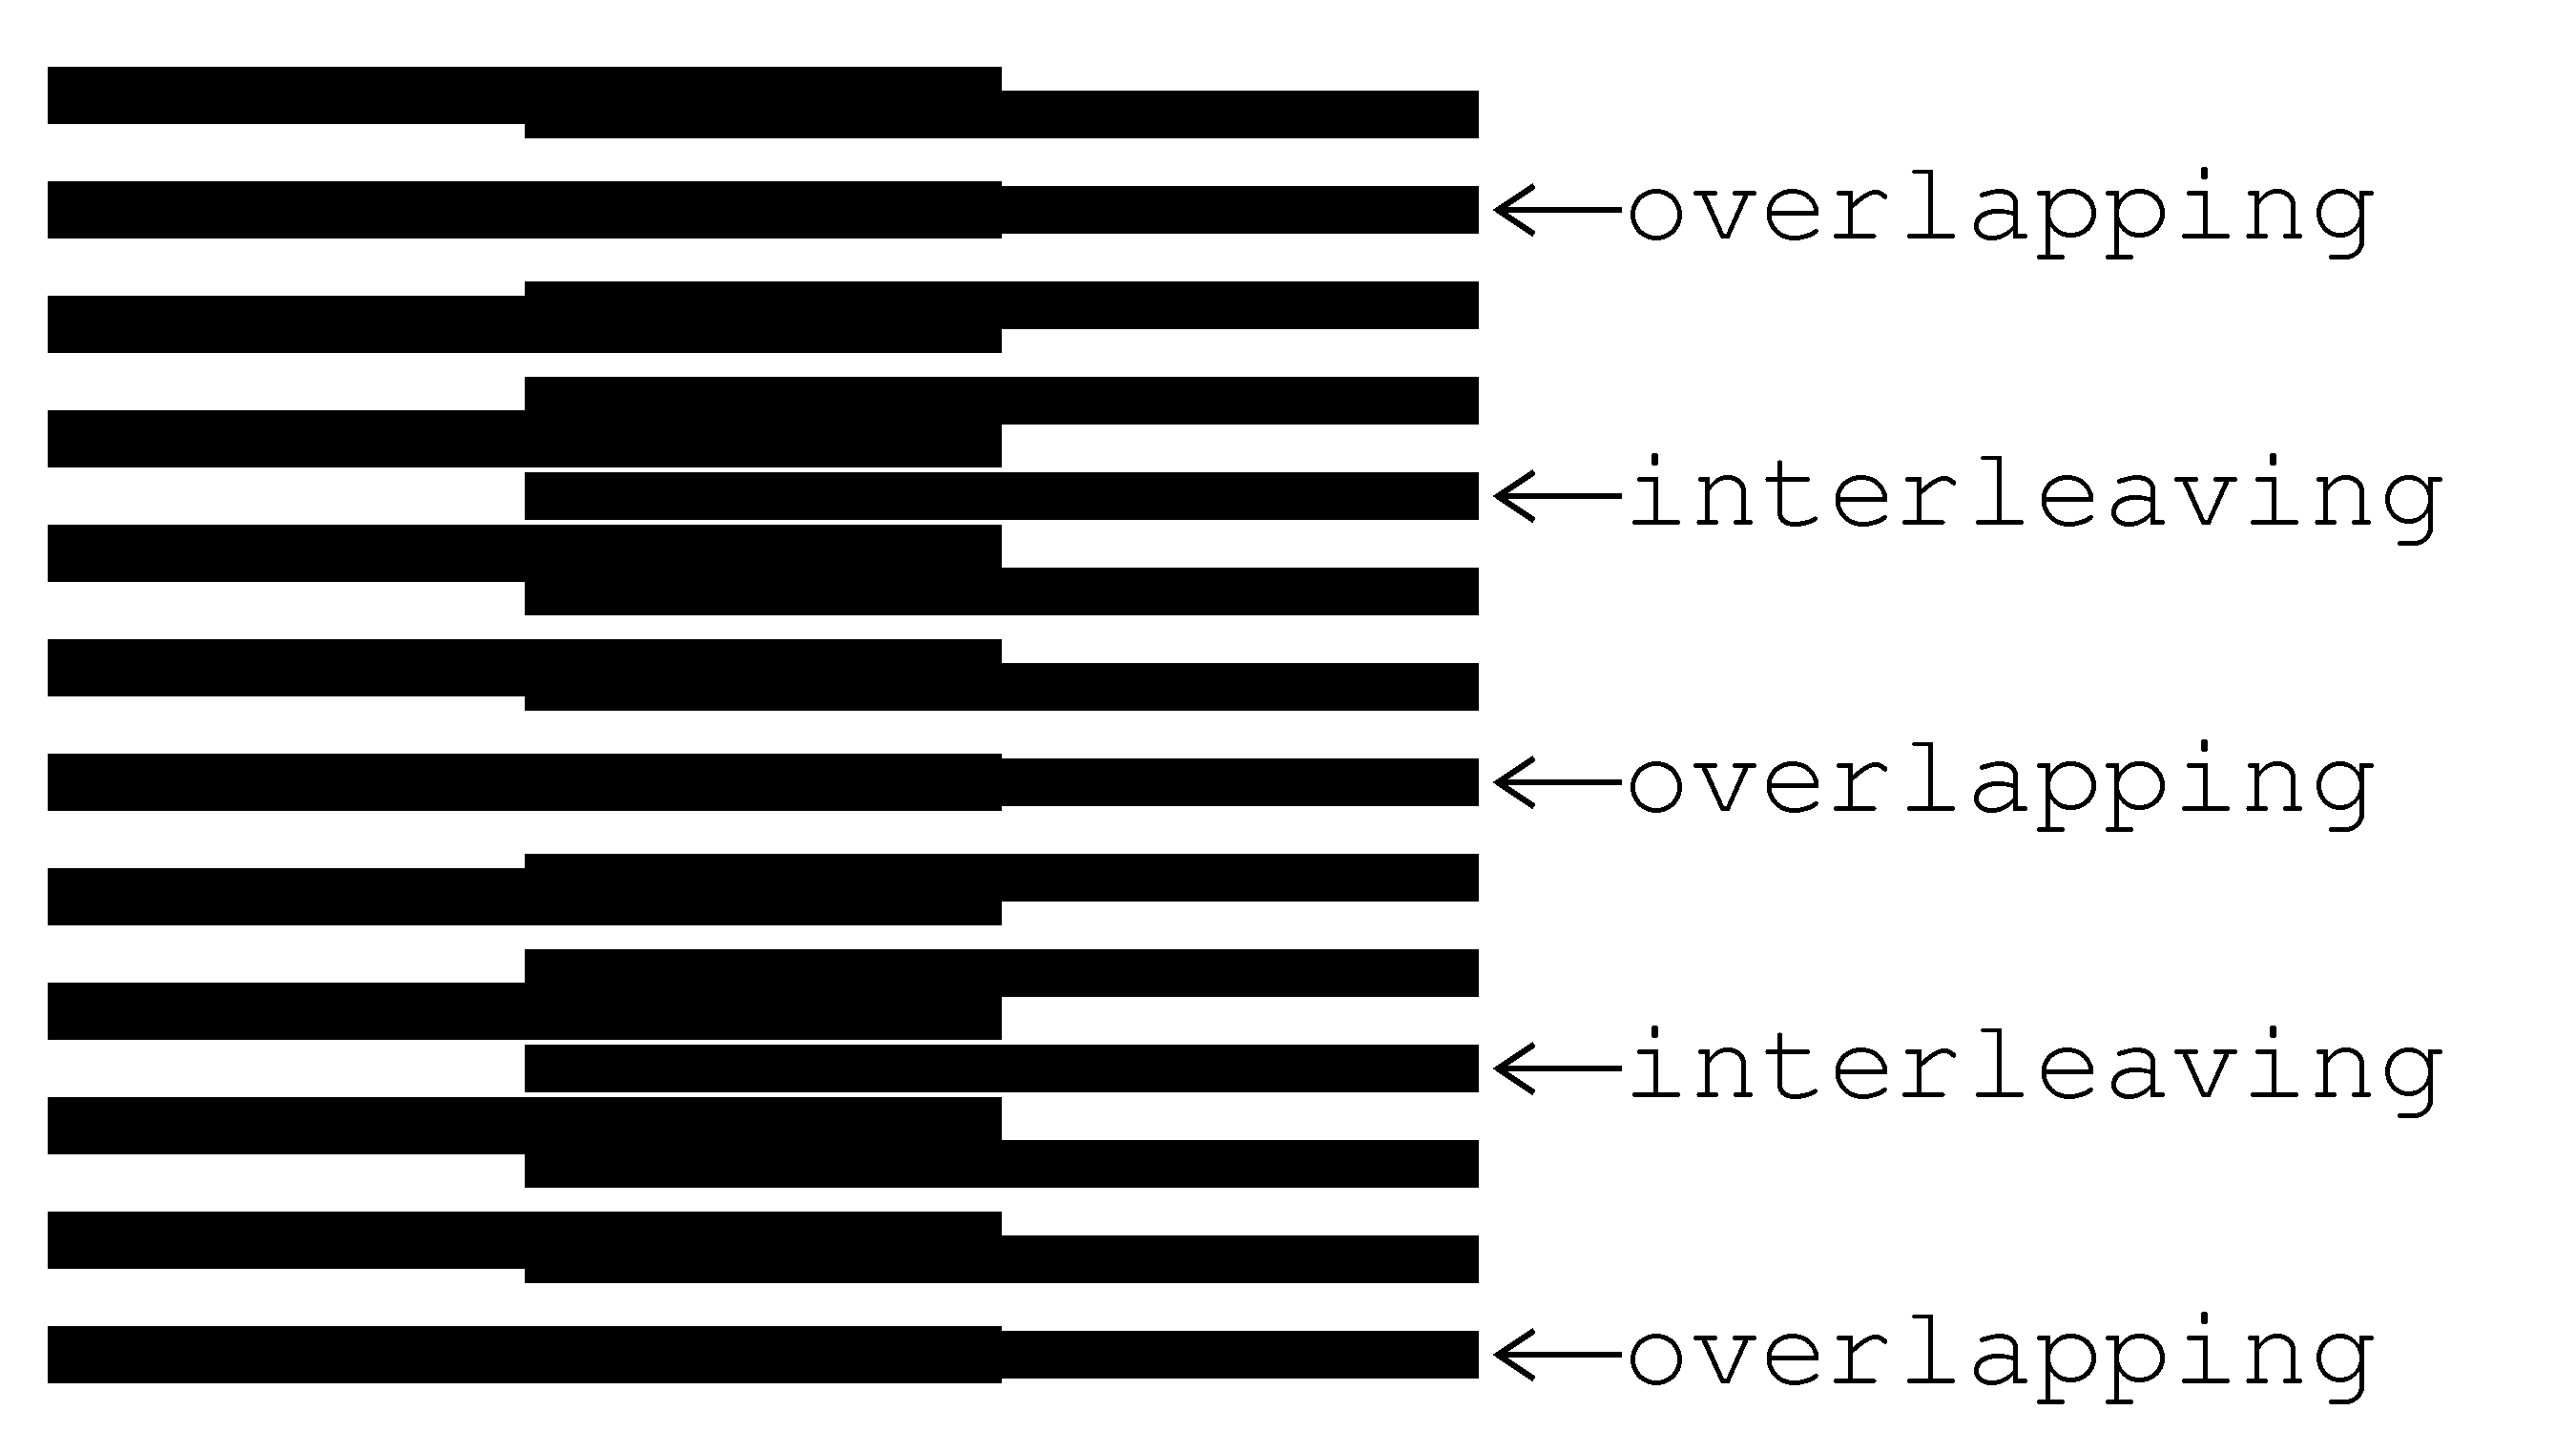
Light bands of the superposition image correspond to the zones where the lines of both layers overlap. The dark bands of the superposition image forming the moiré lines correspond to the zones where the lines of the two layers interleave, hiding the white background. The labels of Figure 2 show the passages from light zones with overlapping layer lines to dark zones with interleaving layer lines. The light and dark zones are periodically interchanging.

Figure 2. The overlapping and interleaving zones of the superposition image [eps], [png]
Figure 3 shows a detailed diagram of the superposition image between two adjacent zones with overlapping lines of the revealing and base layers (i.e. between two light bands).
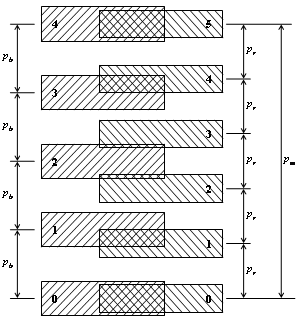
Figure 3. Computing the period of moiré lines in a superposition image as a function of the periods of lines of the revealing and base layers [png]
The period ![]() of
moiré lines is the distance from one point where the lines of both layers
overlap (at the bottom of the figure) to the next such point (at the top). Let
us count the layer lines, starting from the bottom point. At the count 0 the
lines of both layer overlap. Since in our case
of
moiré lines is the distance from one point where the lines of both layers
overlap (at the bottom of the figure) to the next such point (at the top). Let
us count the layer lines, starting from the bottom point. At the count 0 the
lines of both layer overlap. Since in our case ![]() ,
for the same number of counted lines, the base layer lines with a long period
advance faster than the revealing layer lines with a short period. At the
halfway of the distance
,
for the same number of counted lines, the base layer lines with a long period
advance faster than the revealing layer lines with a short period. At the
halfway of the distance ![]() , the base
layer lines are ahead the revealing layer lines by a half a period (
, the base
layer lines are ahead the revealing layer lines by a half a period (![]() ) of the revealing layer lines, due to
which the lines are interleaving, forming a dark band. At the full distance
) of the revealing layer lines, due to
which the lines are interleaving, forming a dark band. At the full distance ![]() , the base layer lines are ahead of the revealing
layer lines by a full period
, the base layer lines are ahead of the revealing
layer lines by a full period ![]() , so the
lines of the layers again overlap. The base layer lines gain the distance
, so the
lines of the layers again overlap. The base layer lines gain the distance ![]() with as many lines (
with as many lines (![]() ) as the number of the revealing layer
lines (
) as the number of the revealing layer
lines (![]() ) for the same distance minus
one:
) for the same distance minus
one:![]() . From here we obtain the well
known formula for the period
. From here we obtain the well
known formula for the period ![]() of the superposition
image:
of the superposition
image:
For the case when the revealing layer period is
longer than the base layer period, the distance between moiré bands is the
absolute value computed by the formula. The superimposition of two layers
comprising parallel lines forms an optical image comprising parallel moiré
lines with a magnified period. According to the formula for computing ![]() , the closer the periods of the two layers,
the stronger the magnification factor is.
, the closer the periods of the two layers,
the stronger the magnification factor is.
The thicknesses of layer lines affect the
overall darkness of the superposition image and the thickness of the moiré
bands, but the period ![]() does not depend on
the layer lines’ thickness.
does not depend on
the layer lines’ thickness.
2. Speedup of movements with moiré
The moiré bands of Figure 1 will move if we displace the revealing layer. When the revealing layer moves perpendicularly to layer lines, the moiré bands move along the same axis, but several times faster than the movement of the revealing layer.
The GIF animation shown in Figure 4 corresponds
to a slow movement of the revealing layer. The GIF file repeatedly animates an upward
movement of the revealing layer (perpendicular to layer lines) across a
distance equal to ![]() . The animation
demonstrates that the moiré lines of the superposition image move up at a speed,
much faster than the movement speed of the revealing layer.
. The animation
demonstrates that the moiré lines of the superposition image move up at a speed,
much faster than the movement speed of the revealing layer.
Figure 4. Slow movement of the revealing layer upward [ps], [gif]
When the revealing layer is shifted up
perpendicularly to the layer lines by one full period ![]() of its pattern, the superposition optical
image must be the same as the initial one. It means that the moiré lines
traverse a distance equal to the period of the superposition image
of its pattern, the superposition optical
image must be the same as the initial one. It means that the moiré lines
traverse a distance equal to the period of the superposition image ![]() while the revealing layer traverses the
distance equal to its period
while the revealing layer traverses the
distance equal to its period ![]() . Assuming
that the base layer is immobile (
. Assuming
that the base layer is immobile (![]() ), the
following equation represents the ratio of the optical speed to the revealing
layer’s speed:
), the
following equation represents the ratio of the optical speed to the revealing
layer’s speed:
By replacing ![]() with
its formula, we have:
with
its formula, we have:
In case the period of the revealing layer is longer than the period of the base layer, the optical image moves in the opposite direction. The negative value of the ratio computed according to the formula signifies a movement in the reverse direction.
3. Superposition of layers with inclined lines
Here we present patterns with inclined lines. When
we are interested in optical speedup we can represent the case of inclined
patterns such that the formulas for computing moiré periods and optical speedups
remain valid in their current simplest form. For this purpose, the values of
periods ![]() ,
, ![]() ,
and
,
and ![]() correspond to the distances between the
lines along the axis of movements (the vertical axis in the animated example of
Figure 4). When the layer lines are perpendicular to the movement axis, the
periods (p) are equal to the distances (denoted as T) between the
lines (as in Figure 4). If the lines are inclined, the periods (p) along
the axis of the movement are not equal to the distances (T) between the
lines.
correspond to the distances between the
lines along the axis of movements (the vertical axis in the animated example of
Figure 4). When the layer lines are perpendicular to the movement axis, the
periods (p) are equal to the distances (denoted as T) between the
lines (as in Figure 4). If the lines are inclined, the periods (p) along
the axis of the movement are not equal to the distances (T) between the
lines.
3.1. Computing moiré lines’ inclination as function of the inclination of layers’ lines
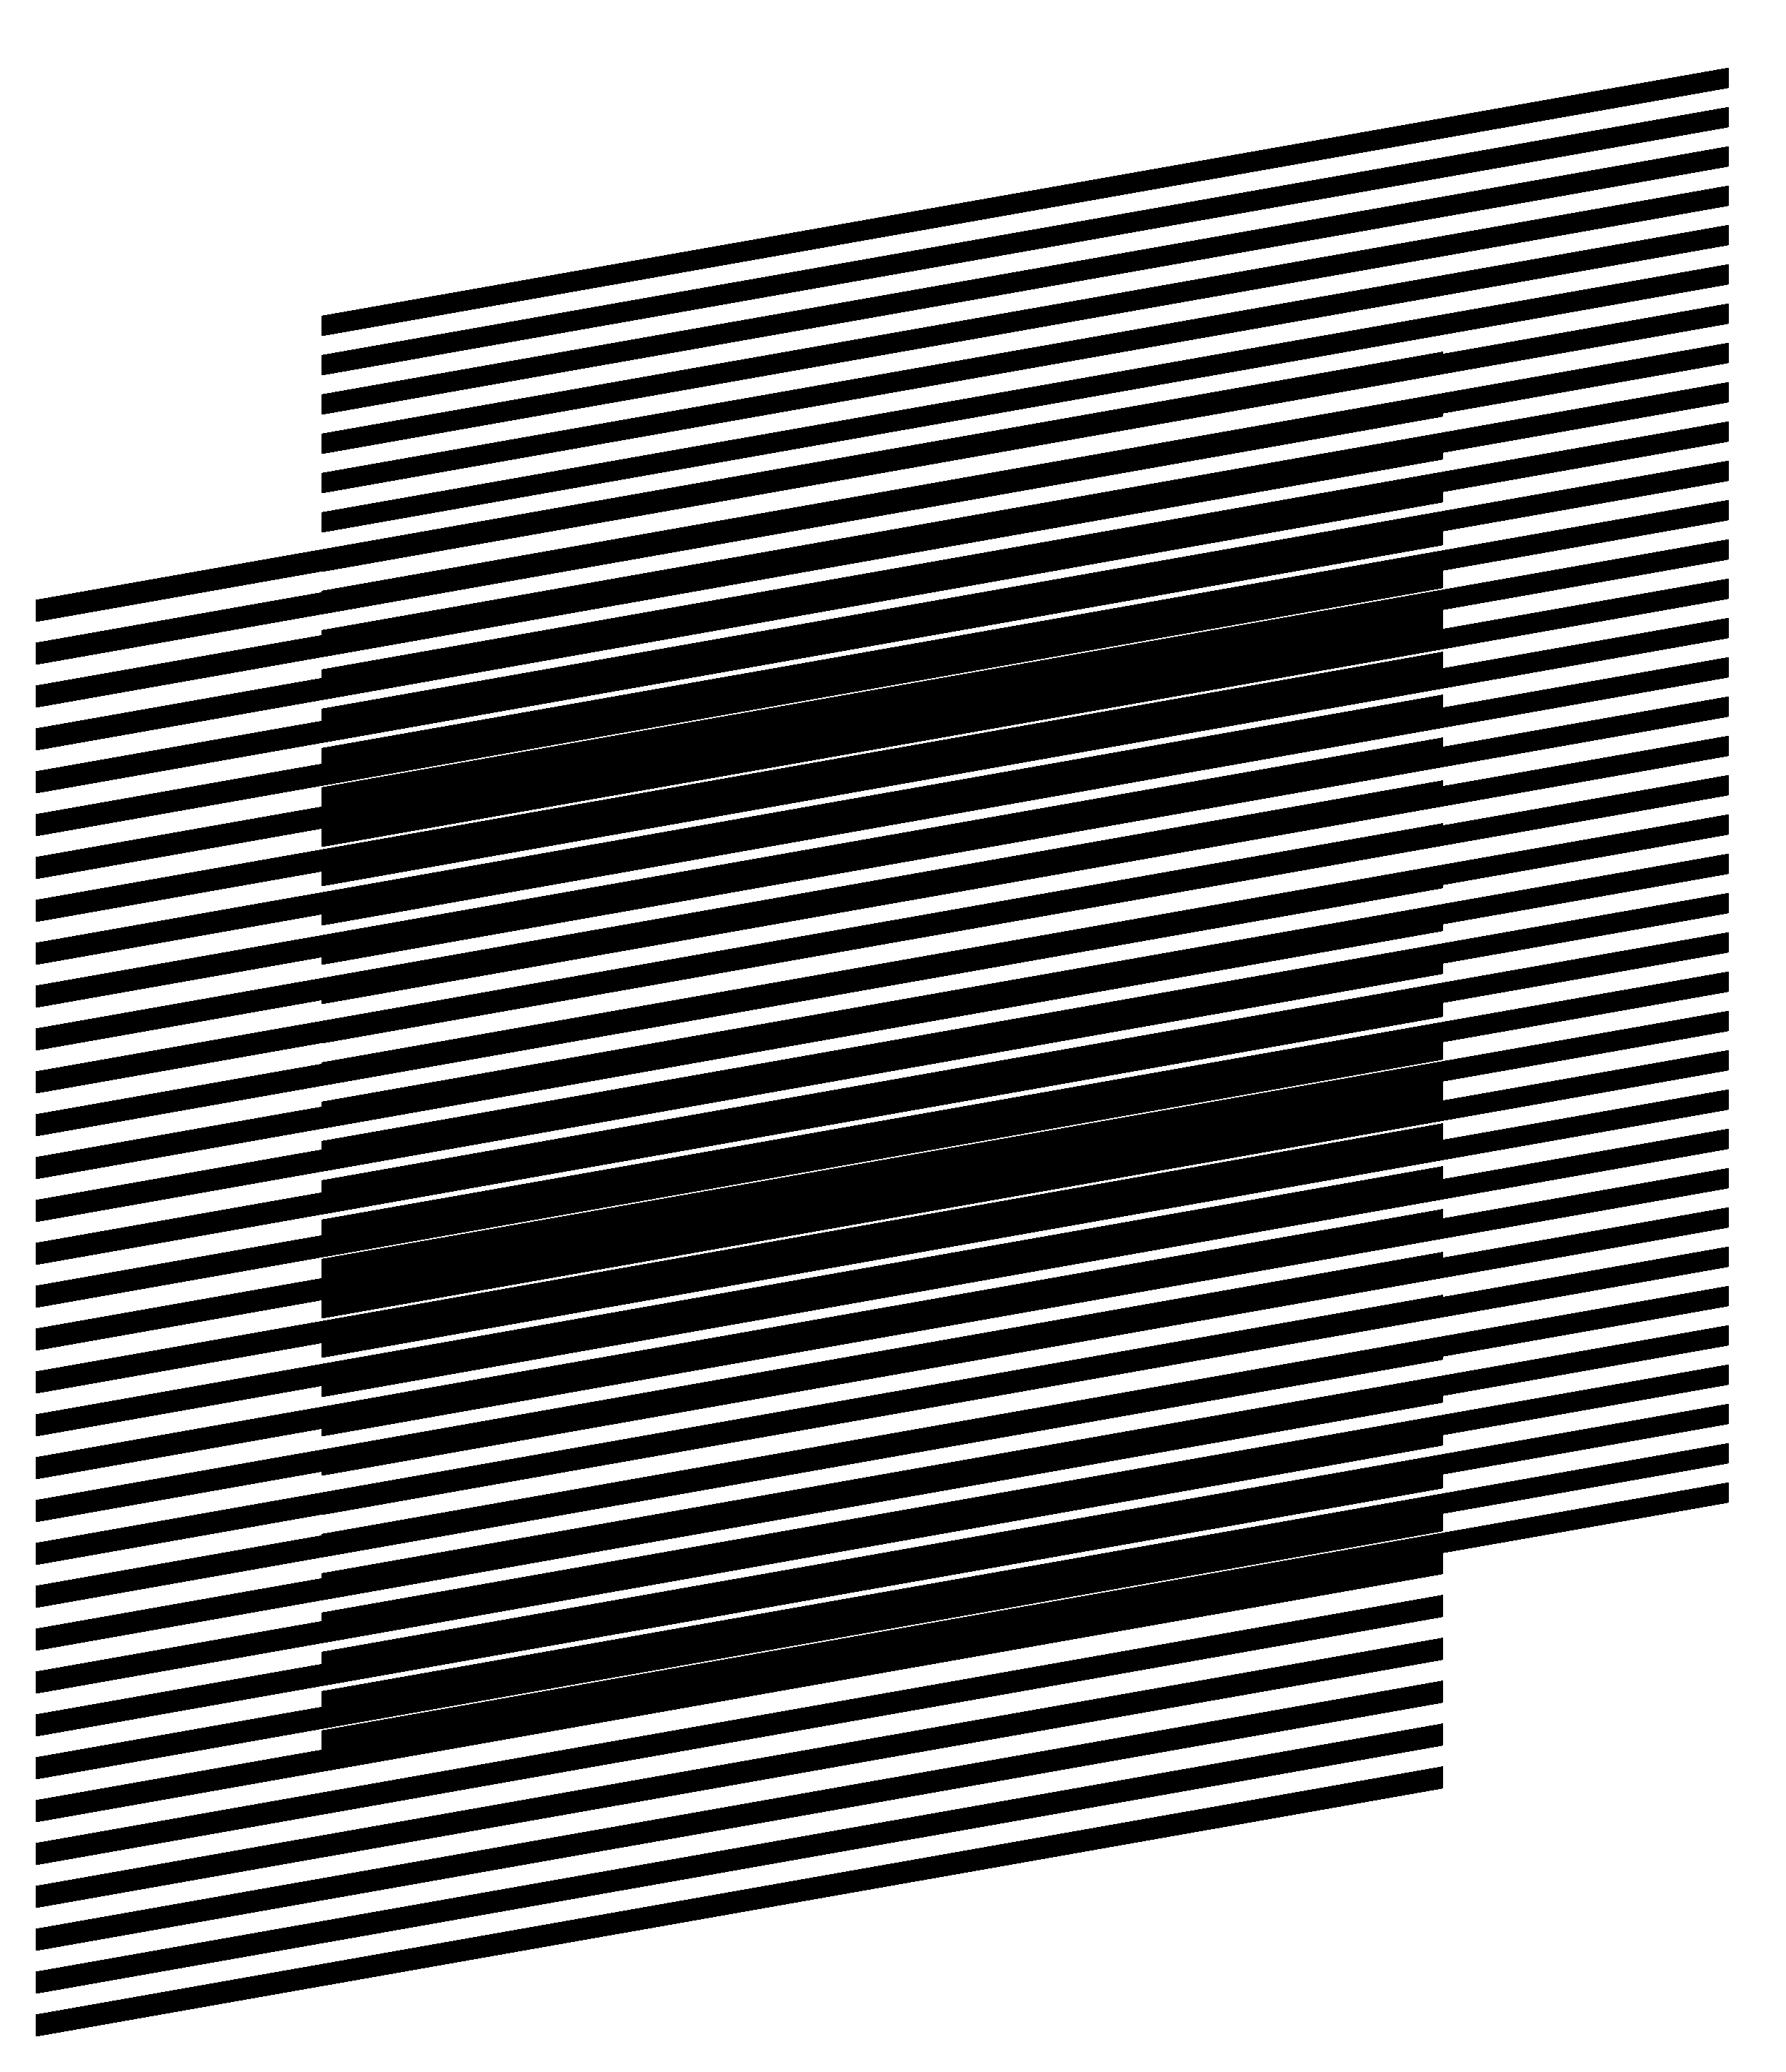
The superposition of two layers with identically
inclined lines forms moiré lines inclined at the same angle. Figure 5 is
obtained from Figure 1 with a vertical shearing. In Figure 5 the layer lines and
the moiré lines are inclined by 10 degrees. Since the inclination is not a
rotation, during the inclination the distance (p) between the layer
lines along the vertical axis is conserved, but the true distance (T)
between the lines (along an axis perpendicular to these lines) is changed. The
difference between the vertical periods ![]() ,
,
![]() , and the distances
, and the distances ![]() ,
, ![]() is
shown in the diagram of Figure 8.
is
shown in the diagram of Figure 8.
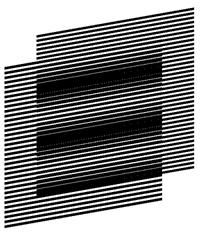
Figure 5. Identical inclination degree of layer lines [eps], [png]
The inclination degree of layer lines may change
along the horizontal axis forming curves. The superposition of two layers with
identical inclination pattern forms moiré curves with the same inclination
pattern. In Figure 6 the inclination degree of layer lines gradually changes
according the following sequence of degrees (+30, –30, +30, –30, +30). Layer
periods ![]() and
and ![]() represent the distances between the curves
along the vertical axis. The presented formulas for computing the period
represent the distances between the curves
along the vertical axis. The presented formulas for computing the period![]() (the vertical distance between the moiré
curves) and the optical speedup (along the vertical axis) are valid for Figure 6.
(the vertical distance between the moiré
curves) and the optical speedup (along the vertical axis) are valid for Figure 6.
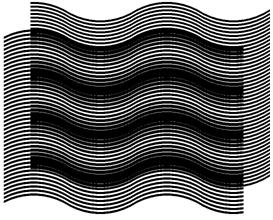
Figure 6. Identical curves in all patterns [eps], [png]
More interesting is the case when the inclination degrees of
layer lines are not the same for the base and revealing layers. Figure 7 shows an animation of a superposition images where the inclination
degree of base layer lines is constant (10 degrees), but the inclination of the
revealing layer lines oscillates between 5 and 15 degrees. The periods of
layers along the vertical axis ![]() and
and ![]() are the same all the time. Correspondingly,
the period
are the same all the time. Correspondingly,
the period ![]() (along the vertical axis) computed
with the basic formula also remains the same.
(along the vertical axis) computed
with the basic formula also remains the same.

Figure 7. Changing inclination of revealing layer lines [ps], [gif]
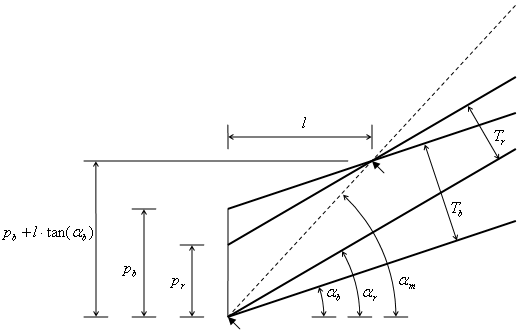
Figure 8 helps to compute the inclination degree
of moiré optical lines as a function of the inclination of the revealing and
the base layer lines. We draw the layer lines schematically without showing
their true thicknesses. The bold lines of the diagram inclined by ![]() degrees are the base layer lines. The bold
lines inclined by
degrees are the base layer lines. The bold
lines inclined by ![]() degrees are the
revealing layer lines. The base layer lines are vertically spaced by a distance
equal to
degrees are the
revealing layer lines. The base layer lines are vertically spaced by a distance
equal to ![]() , and the revealing layer lines
are vertically spaced by a distance equal to
, and the revealing layer lines
are vertically spaced by a distance equal to ![]() .
The distances
.
The distances ![]() and
and ![]() represent the true space between the
base layer and revealing layer lines, correspondingly. The intersections of the
lines of the base and the revealing layers (marked in the figure by two arrows)
lie on a central axis of a light moiré band. The dashed line of Figure 8
corresponds to the axis of the light moiré band. The inclination degree of
moiré lines is therefore the inclination
represent the true space between the
base layer and revealing layer lines, correspondingly. The intersections of the
lines of the base and the revealing layers (marked in the figure by two arrows)
lie on a central axis of a light moiré band. The dashed line of Figure 8
corresponds to the axis of the light moiré band. The inclination degree of
moiré lines is therefore the inclination ![]() of
the dashed line.
of
the dashed line.


Figure 8. Computing the inclination angle of moiré lines [png]
From Figure 8 we deduce the following two equations:

From these equations we deduce the equation for computing the inclination of moiré lines as a function of the inclinations of the base layer and the revealing layer lines:
3.2. Deducing other known formulas
The true pattern periods ![]() ,
,
![]() , and
, and ![]() (along
the axes perpendicular to pattern lines) are computed as follows (see Figure 8):
(along
the axes perpendicular to pattern lines) are computed as follows (see Figure 8):
|
|
From here, using the formula for computing tan(![]() ) with periods p, we deduce a well
known formula for the moiré angle
) with periods p, we deduce a well
known formula for the moiré angle ![]() with periods
T:
with periods
T:


In the particular case when ![]() , the formula for the period
, the formula for the period ![]() is reduced into well known formula:
is reduced into well known formula:

And the formula for computing ![]() is
reduced to:
is
reduced to:
3.3. The revealing lines inclination as a function of the superposition image’s lines inclination
Here is the equation for computing the revealing
layer line inclination ![]() for a given base
layer line inclination
for a given base
layer line inclination ![]() , and a desired moiré
line inclination
, and a desired moiré
line inclination ![]() :
:

For any given base layer line inclination, this equation
permits us to obtain a desired moiré line inclination by properly choosing the
revealing layer inclination. In Figure 6 we showed an example where the curves
of layers follow an identical inclination pattern forming a superposition image
with the same inclination pattern. The inclination degrees of the layers’ and
moiré lines change along the horizontal axis according the following sequence
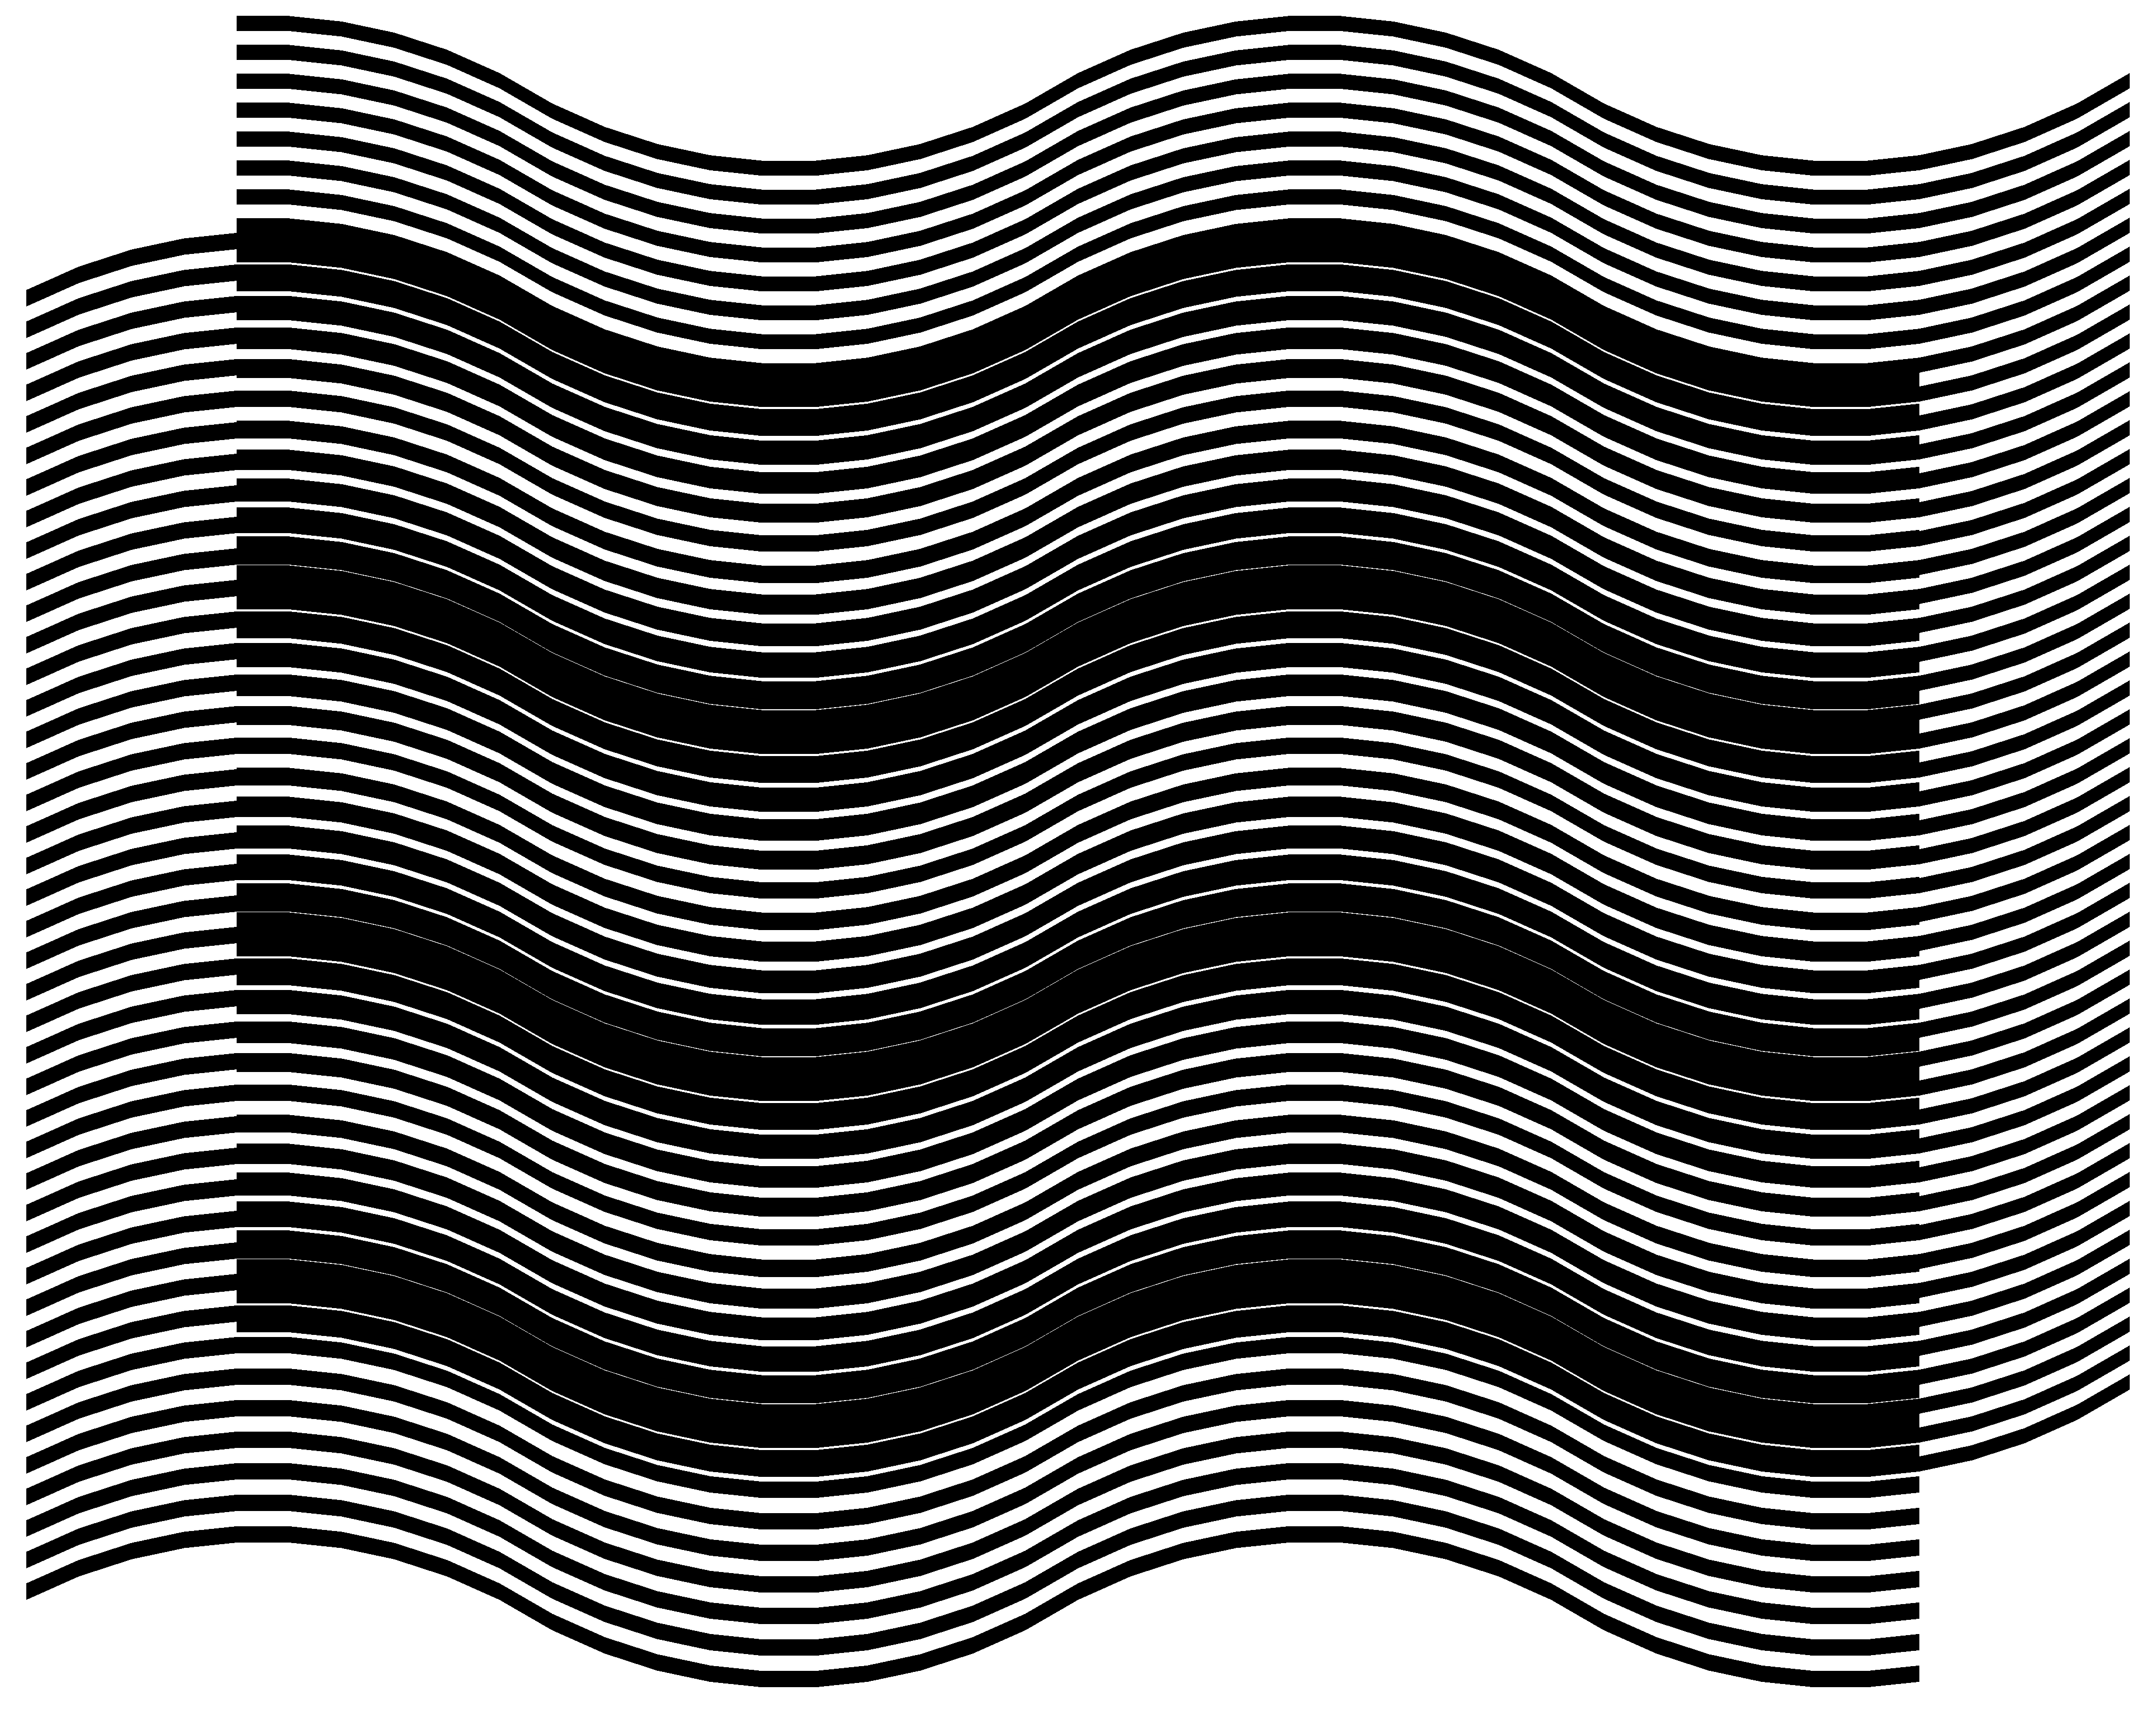
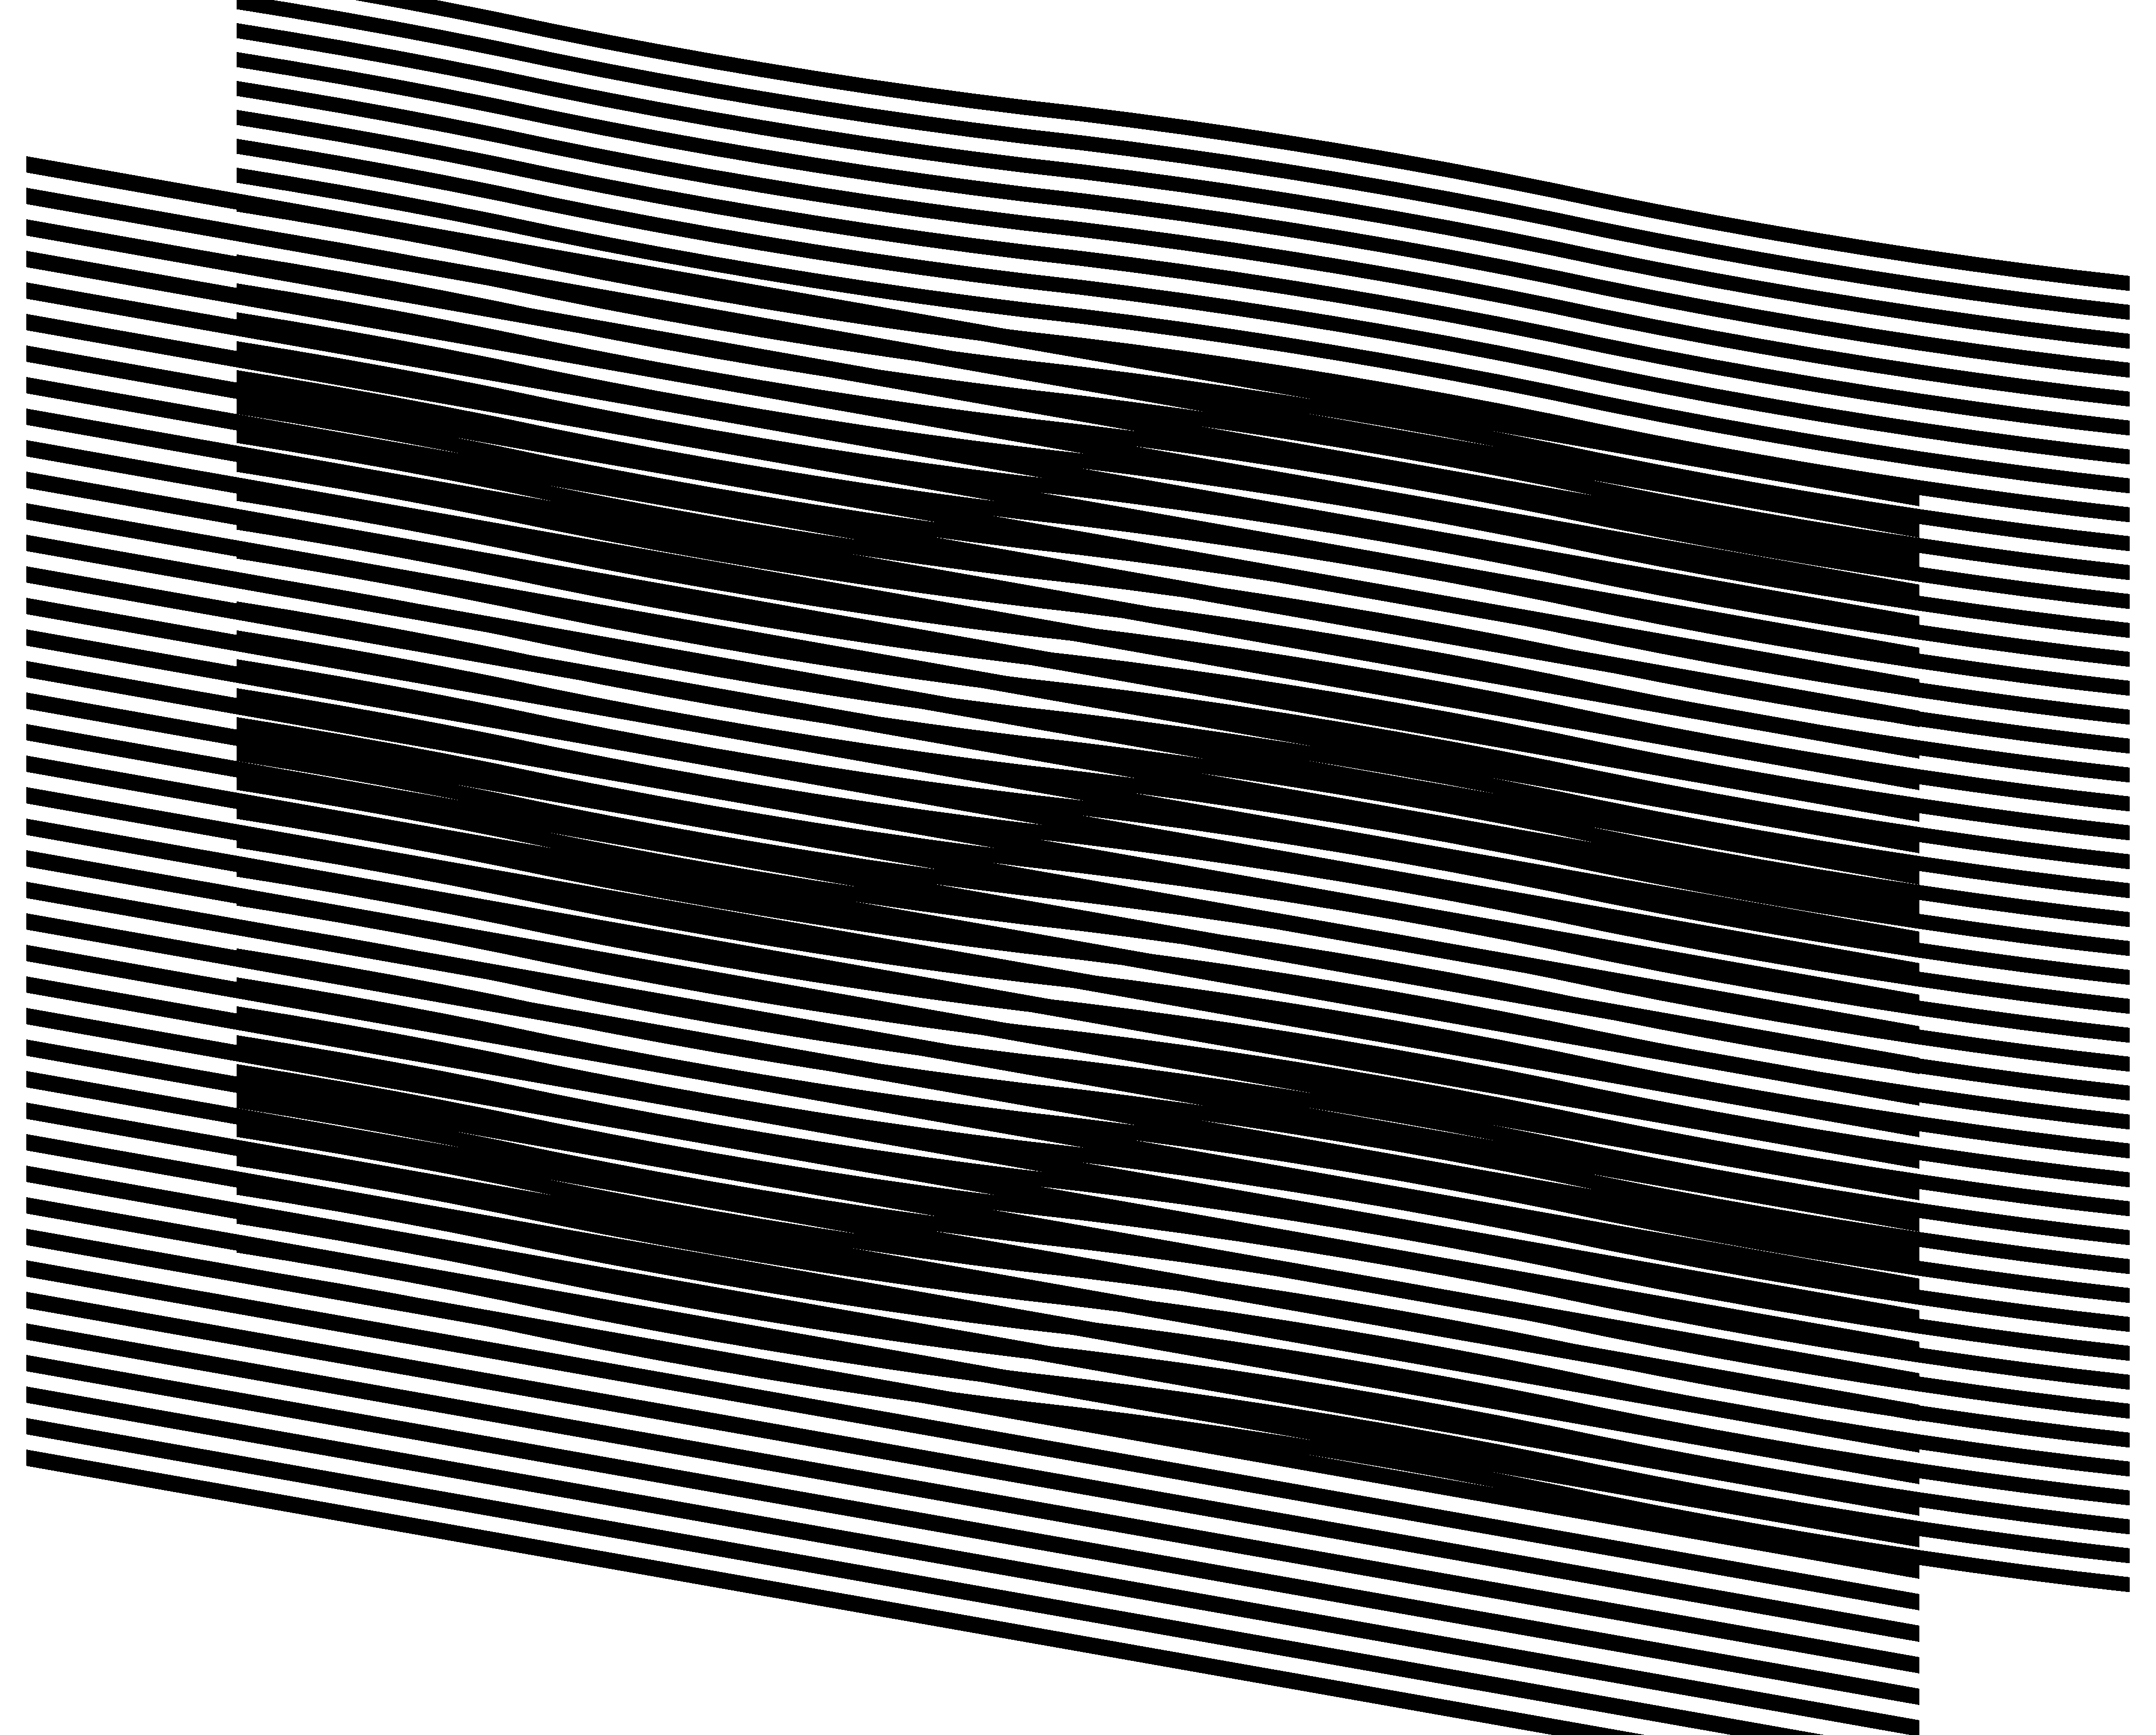
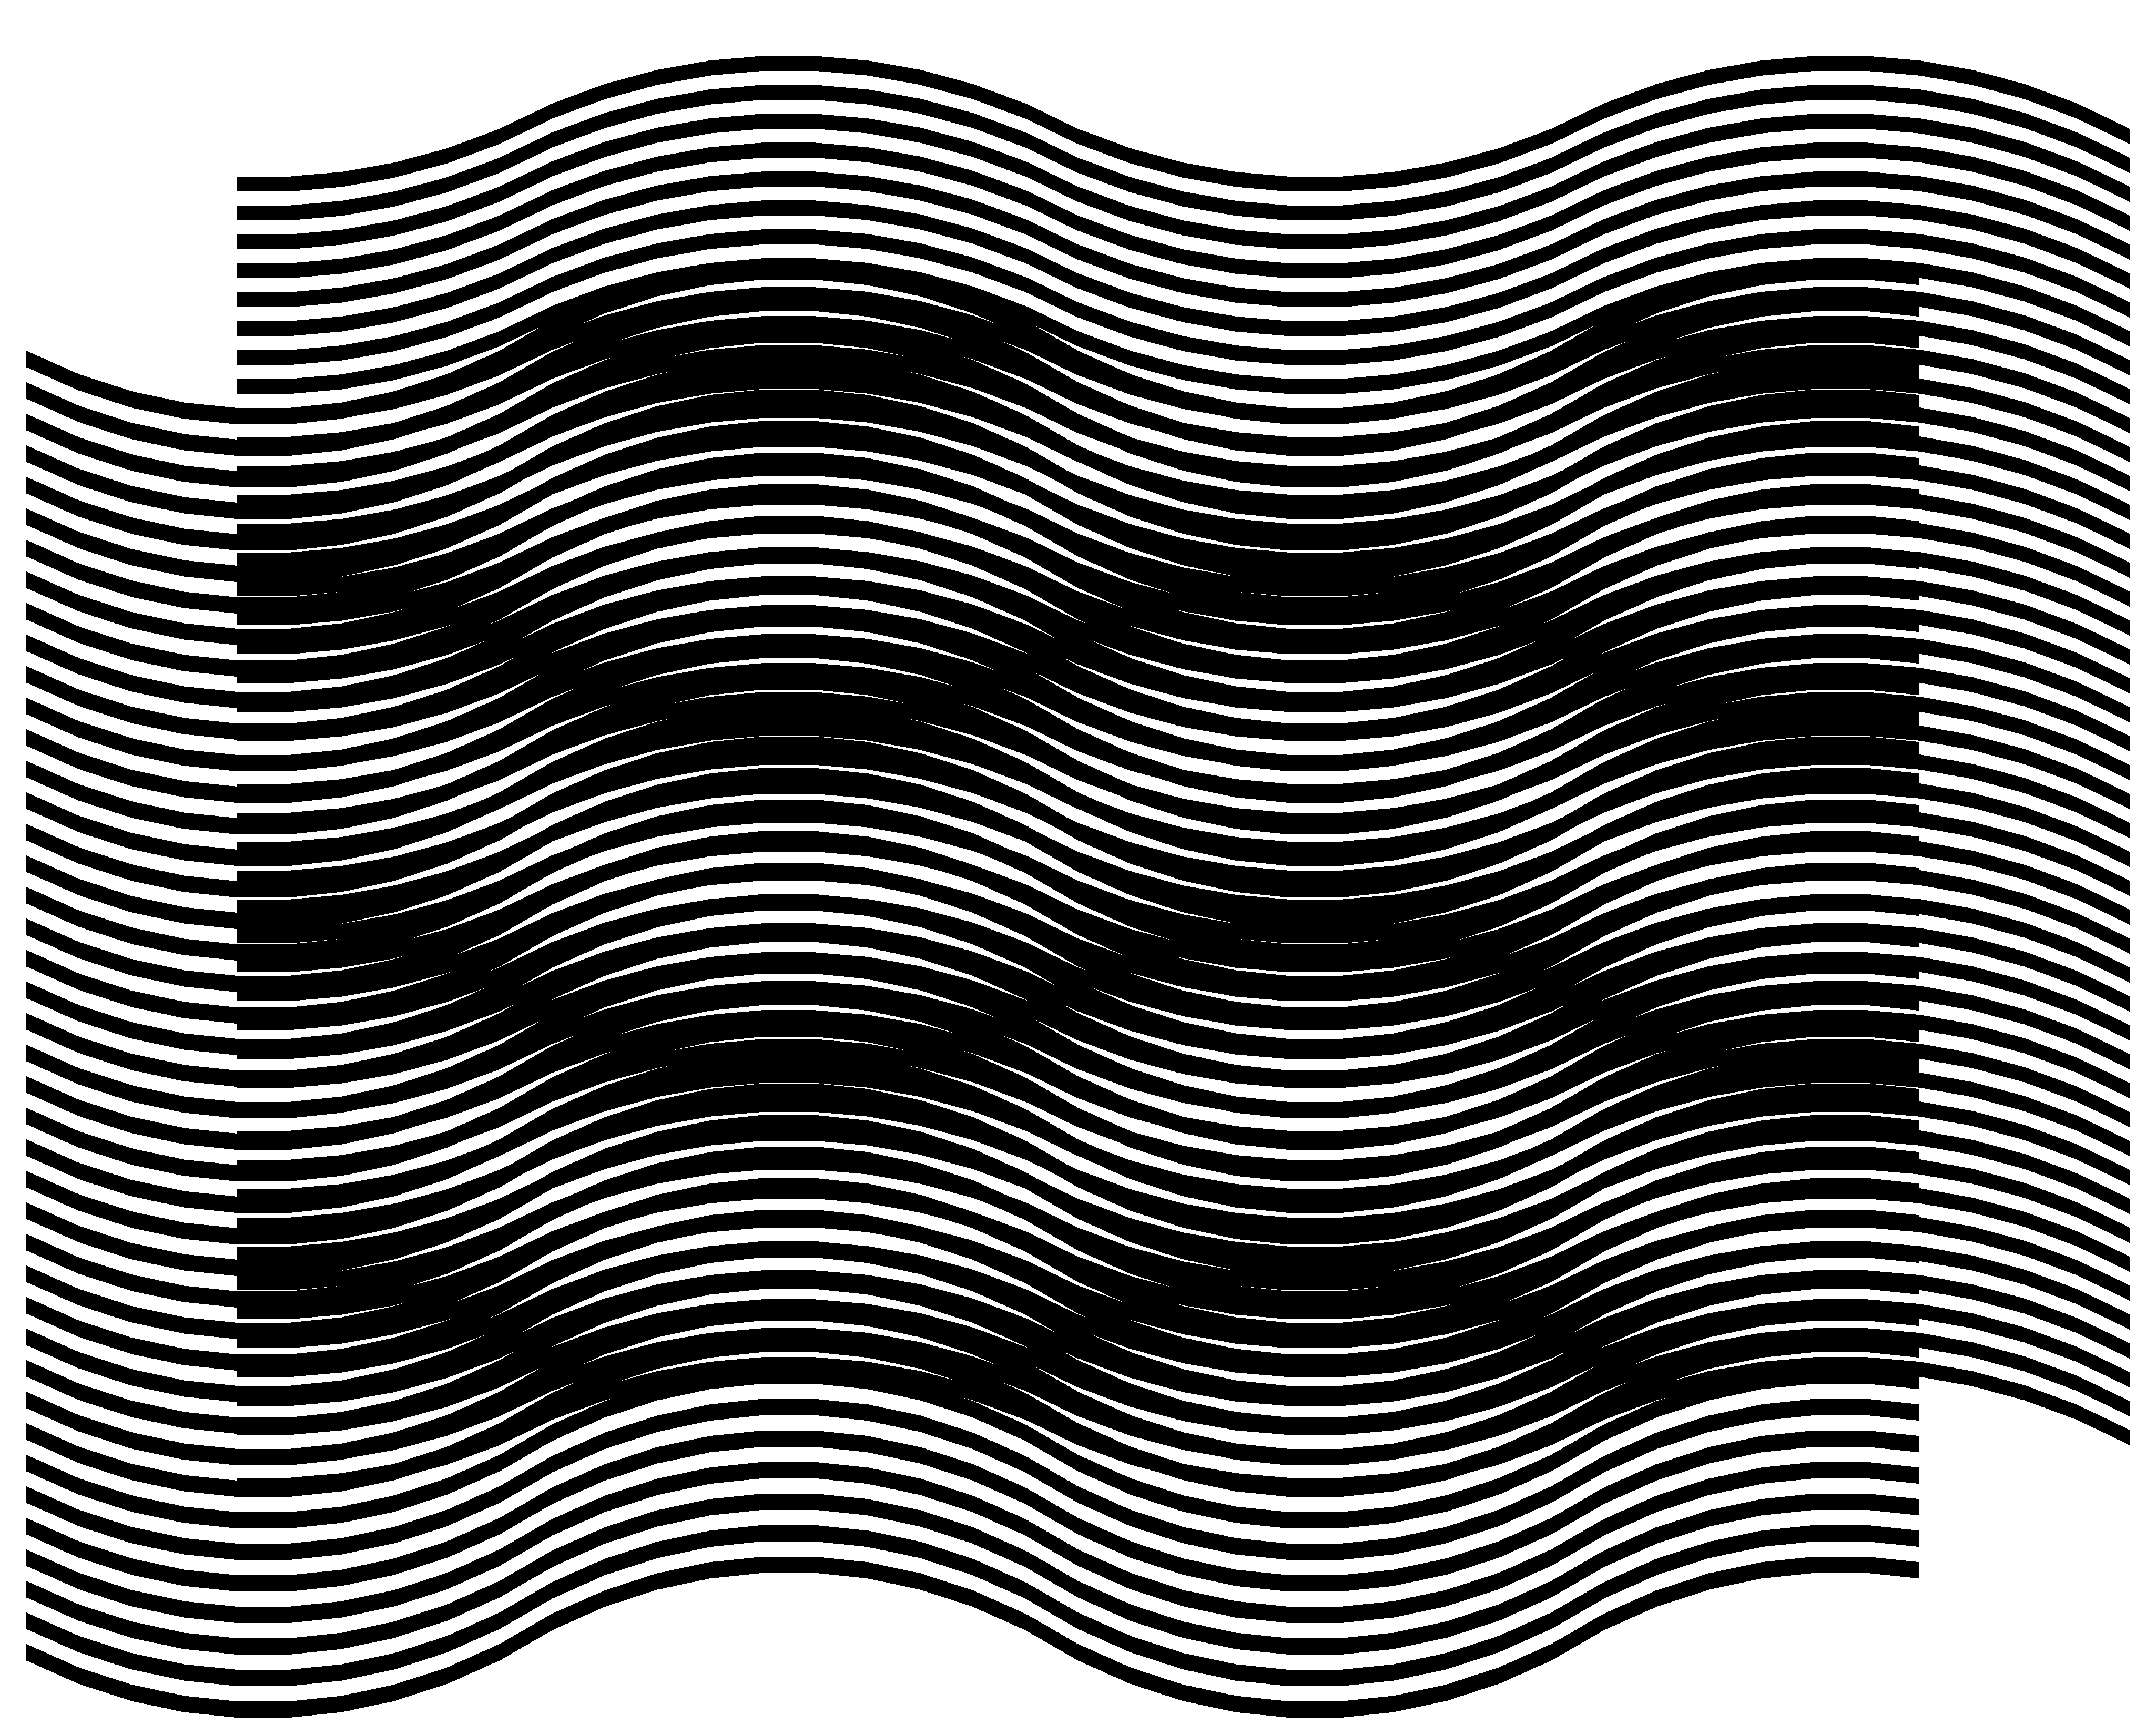
of alternating degree values (+30, –30, +30, –30, +30). In Figure 9 we obtain
the same superposition pattern as in Figure 6, but with a base layer comprising
straight lines inclined by –10 degrees. The revealing pattern of Figure 9 is
computed by interpolating the curves into connected straight lines, where for
each position along the horizontal axis, the revealing line’s inclination angle
![]() is computed as a function of
is computed as a function of ![]() and
and ![]() according
to the equation above. Figure 9 demonstrates that the difference between the
inclination angles of revealing and base layer lines has to be several times
smaller than the difference between inclination angles of moiré and base layer
lines.
according
to the equation above. Figure 9 demonstrates that the difference between the
inclination angles of revealing and base layer lines has to be several times
smaller than the difference between inclination angles of moiré and base layer
lines.
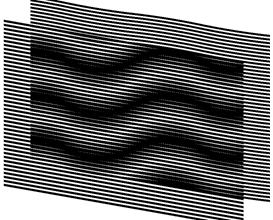
Figure 9. The base layer with inclined straight lines with the wavy moiré pattern [eps], [png]
Another example forming the same superposition patterns as in Figure 6 and Figure 9 is shown in Figure 10. In Figure 10 the desired inclination pattern (+30, –30, +30, –30, +30) is obtained using a base layer with an inverted inclination pattern (–30, +30, –30, +30, –30).
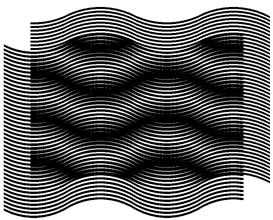
Figure 10. Inversed base layer and moiré lines [eps], [png]
Figure 11 shows an animation where we obtain a superposition image with a constant inclination pattern of moiré lines (+30, –30, +30, –30, +30) for modifying pairs of base and revealing layers. The base layer inclination pattern gradually changes and the revealing layer inclination pattern correspondingly adapts such that the superposition image’s inclination pattern remains the same.
Figure 11. The same moiré curves with modifying layer patterns [ps], [gif]
4. References
[Gabrielyan07a] Emin Gabrielyan, The basics of line moiré patterns and optical speedup, 2007
5. Links
070212 Random moiré [CH], [US]
070227 Random line moiré [CH], [US]
070306 Periodic line moiré patterns and optical speedup [CH], [US]